
NetNutri: 10,271 Supplement Purchases From Google Ads at 2.21x Conversion Value
This supplement Google Ads case study covers NetNutri, a US online store selling many supplement brands, run on Shopping and Performance Max campaigns from September 2023 to May 2026. Every number on this page is read straight off the Google Ads report.
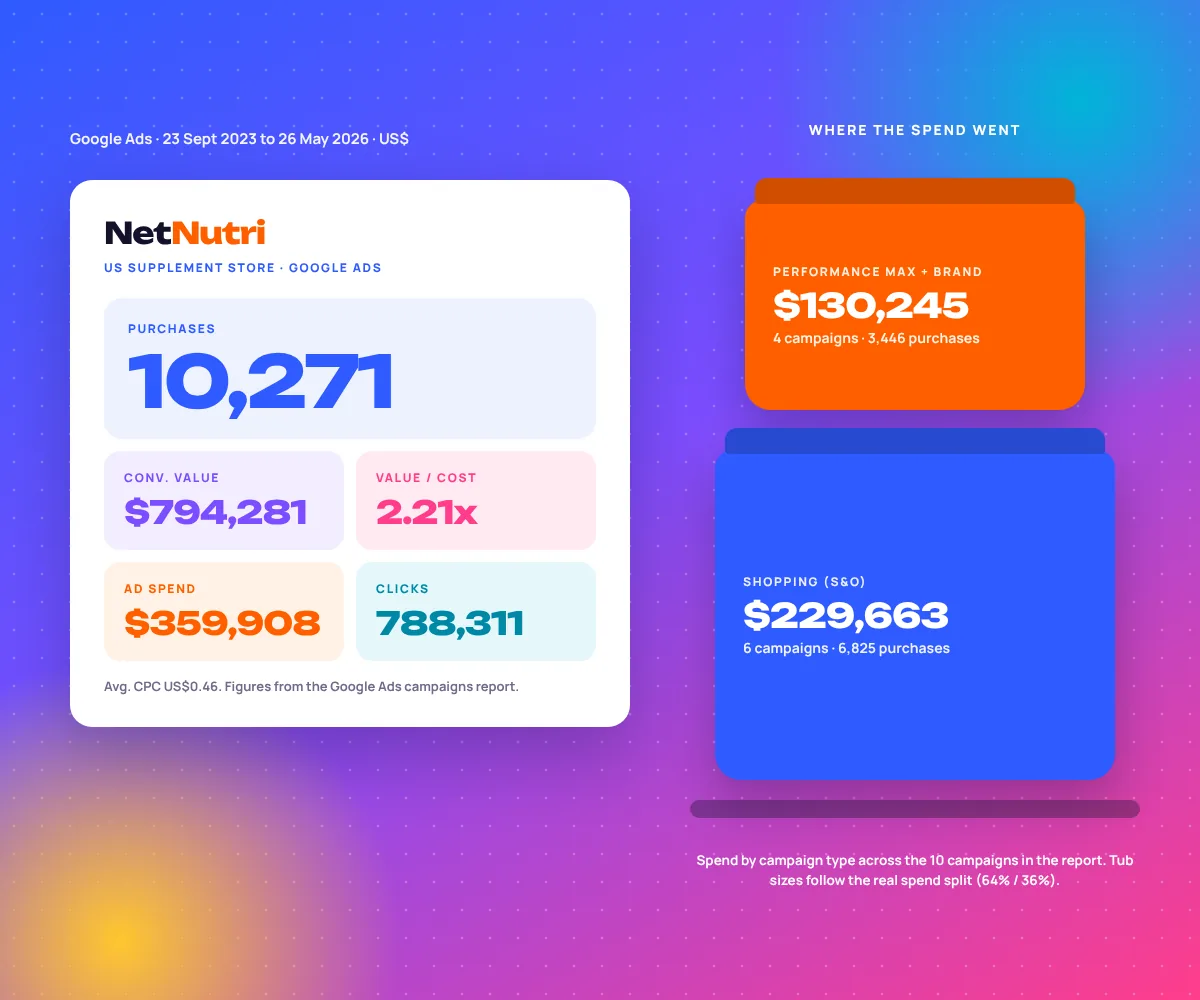
- 10,271purchases
- $794,281conversion value
- 2.21xvalue per $1 spent
- $0.46avg. CPC
- ClientNetNutri
- IndustryEcommerce, nutrition and supplements
- MarketUnited States
- ChannelGoogle Ads
- Campaign typesShopping, Performance Max
- Report period23 Sept 2023 to 26 May 2026
- Ad spend in the reportUS$359,908
Supplement Google Ads Case Study: A Many-Brand Shop, Sold One Search at a Time
NetNutri sells products from a long list of supplement brands to US shoppers. Google Ads is where those shoppers type the exact product they already want, often with the brand, the size and the capsule count in the search.
It is one of the ecommerce marketing accounts we run for 85+ clients across several countries. This page shows how the account is built, how the spend split between Shopping and Performance Max, why we report purchases and not Google’s “conversions” column, and the screenshot the numbers come from.
Why Supplement Brands Find Google Ads Hard
None of these are unique to NetNutri. They are what every multi-brand supplement retailer runs into on Google.
The same tub is sold everywhere
A shopper searching for a branded product sees five stores selling the identical item. Price, delivery and the product title decide the click, not the creative.
Clicks are cheap, margins are thin
Low cost per click looks great until you see the margin on a $30 bottle. Spend has to follow products that actually make money, not just the ones that sell.
Health policies bite
Google restricts some ingredients and health claims. Feed titles and ad text have to stay inside the policy or products get disapproved and quietly stop serving.
The conversions column flatters you
Count add-to-basket as a conversion and the account looks like a rocket. The number that pays the bills is purchases, so that is what we steer by.
How We Built the Ecommerce Google Ads Account, Layer by Layer
Each layer sits on the one below it. The campaign names in the report show how the account is organised; the notes on each layer explain how this kind of setup is built and why.
A weak feed under a clever bid strategy still loses. So the order matters more than any single trick. It is the same order our Google Ads management team uses on every Shopping account.
- Layer 1 · Foundation
Product feed and Merchant Center
Titles that carry brand, product, size and count the way people search (think “30 capsules”), clean GTINs, and wording that passes Google’s health policies.
- Layer 2
Shopping, split by device and intent
Shopping campaigns (the
S&Oones) split desktop from mobile and give high-value search terms their own campaign, so each gets its own budget and bids. - Layer 3
Performance Max for the core range
A Performance Max campaign for the core health and wellness range and an overall sales one, to reach shoppers across YouTube, Discover and Gmail as well as Search.
- Layer 4
Brand and new-stock pushes
Separate campaigns for specific brands and new stock, so a fresh line gets spend on purpose instead of waiting for the algorithm to notice it.
- Layer 5
Bid strategy experiments
A Target ROAS experiment run against the main desktop Shopping campaign, with a split of traffic, before changing how the main campaign bids.
- Layer 6 · Top
Measure purchases on their own
Purchase and add-to-basket tracked as separate columns, so the team reads real orders and value per dollar, not a blended conversion count.
Google Shopping Ads Case Study: Where the $359,908 Went
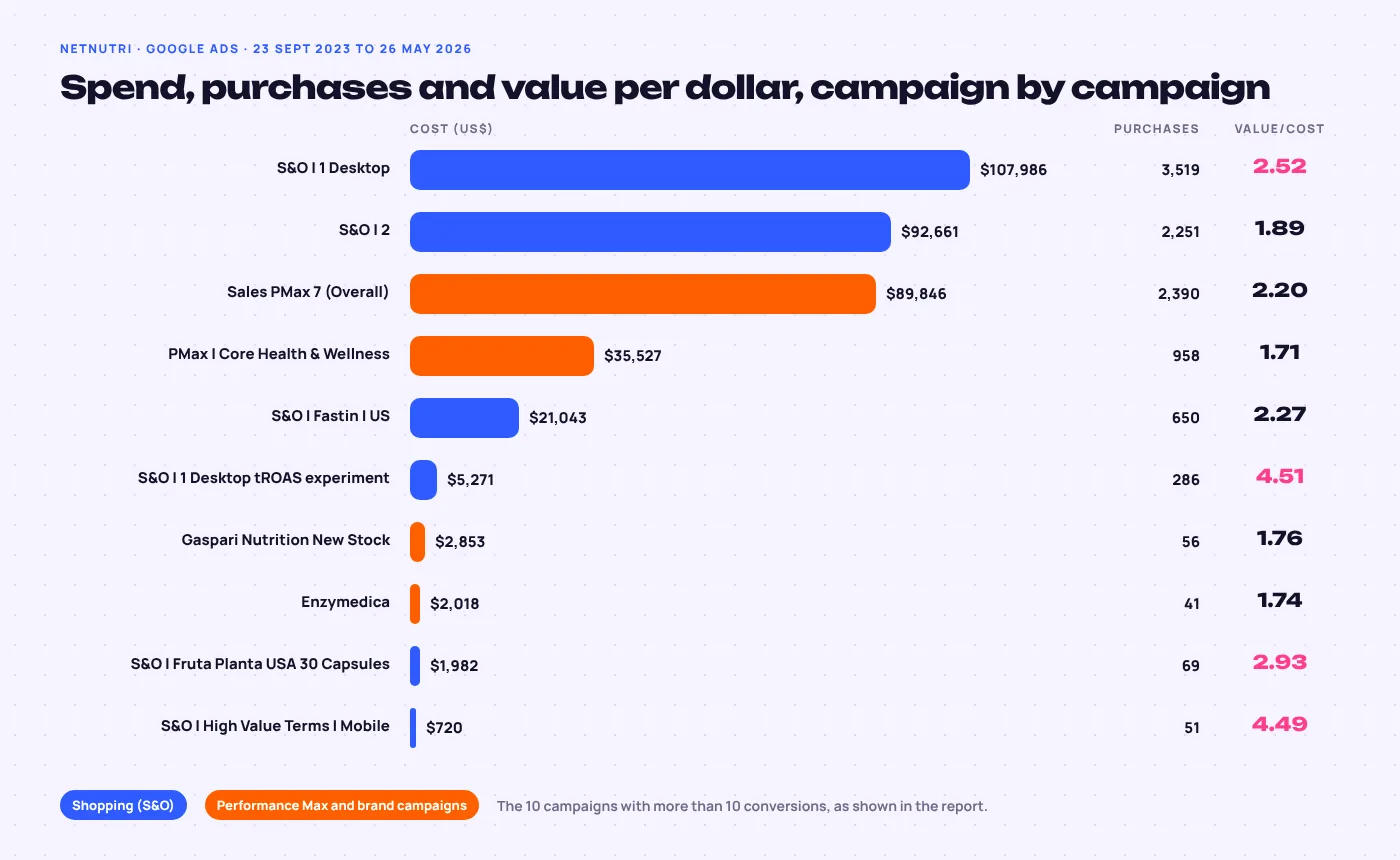
Ten campaigns with more than 10 conversions each, straight from the report. Shopping took most of the budget and returned most of the purchases.
Google Shopping campaigns
US$229,663 of spend across 6 campaigns, 6,825 purchases and $527,760 conversion value, about 2.30x value per dollar.
Performance Max and brand campaigns
US$130,245 of spend across 4 campaigns, 3,446 purchases and $266,521 conversion value, about 2.05x value per dollar.
Group totals and the 2.30x and 2.05x figures are our sums of the campaign rows in the screenshot; they add up exactly to the report total. The highest value per dollar came from two small campaigns: the Target ROAS experiment (4.51 on $5,271) and the high-value mobile terms (4.49 on $720). Small budgets, so read those as signals, not promises.
220,674 “Conversions”, 10,271 Purchases
The same report holds all three numbers. Only one of them is an order.
Google’s main conversions column. It counts add-to-basket and other actions, so it is not a sales number.
Useful for spotting product pages that get interest but do not close. Not money yet.
Completed orders. This is the number we headline, and the one bids should chase.
About the $794,281. That is Google Ads conversion value as the report shows it. The screenshot does not split it by action, so we call it conversion value, not revenue, and we do not quote a store revenue figure.
Cost per purchase. $359,908 divided by 10,271 purchases is about $35 per order (our calculation), at an average of $0.46 per click across 788,311 clicks.
The Google Ads Report Behind Every Number
The campaigns view of the NetNutri account, custom range 23 Sept 2023 to 26 May 2026, in US dollars.

Refill Notes for Your Own Store
Fix the feed before the bids
If your titles do not say brand, size and count, Shopping cannot match the searches that buy. It is the cheapest fix in the account.
Split by device and intent
Desktop and mobile shoppers behave differently in this category. Separate campaigns let you bid for each instead of averaging them.
Test bid changes as experiments
Run Target ROAS against the old strategy on a share of traffic first. A small, clean test is cheaper than switching the main campaign and hoping.
Report orders, not “conversions”
Ask your agency for purchases and value per dollar. If the headline number includes add-to-basket, the real picture is somewhere much smaller. More examples in our success stories.
Questions About Google Ads for Supplement Stores
What is a good Google Ads ROAS for a supplement store?
It depends on your margin. A 2.21x return means every $1 of ad spend brought $2.21 of tracked conversion value. On a multi-brand store selling other companies’ products, margins are thinner than for an own brand, so the break-even point is the number to compare against, not a generic benchmark.
Why are Google Ads conversions higher than purchases?
Because Google’s conversions column can include actions like add to basket. In this account it showed 220,674 conversions against 10,271 purchases. Purchases are orders; the rest is interest.
Should a supplement brand use Google Shopping or Performance Max?
Usually both, with a clear job each. Standard Shopping gives you control over products, devices and search terms. Performance Max adds reach across Google’s other placements. In this account Shopping took about 64% of spend and returned about 2.30x, against 2.05x for Performance Max and brand campaigns.
Can you advertise supplements on Google Ads?
Most can. Google restricts certain ingredients and health claims, and some products need care with wording. We check the feed and ad text against the healthcare and medicines policy before launch, because disapprovals tend to hit best sellers first.
How long does it take for Google Ads to work for an ecommerce store?
Expect the first month to be about data, and the second and third about trimming waste and moving budget to what sells. That is why we work on a three-month minimum. The numbers on this page cover more than two and a half years.
How do you optimise a Google Shopping feed for supplements?
Put what people type into the title: brand, product name, form, size and count, such as capsules or servings. Add correct GTINs, clean images and accurate prices, and keep health claims out of titles and descriptions so products are not disapproved. Then split campaigns so your best sellers get their own budget.
Ready to Build Your Own Stack?
A free audit of your Google Ads and product feed, with the first changes we would make. Thirty minutes, with the people who would run the account.
Book My Free Audit- Free auditFeed, campaigns and tracking, this week
- First three monthsOur minimum, to build and test properly
- Then month to monthStay because it works, not because of a contract