The short answer
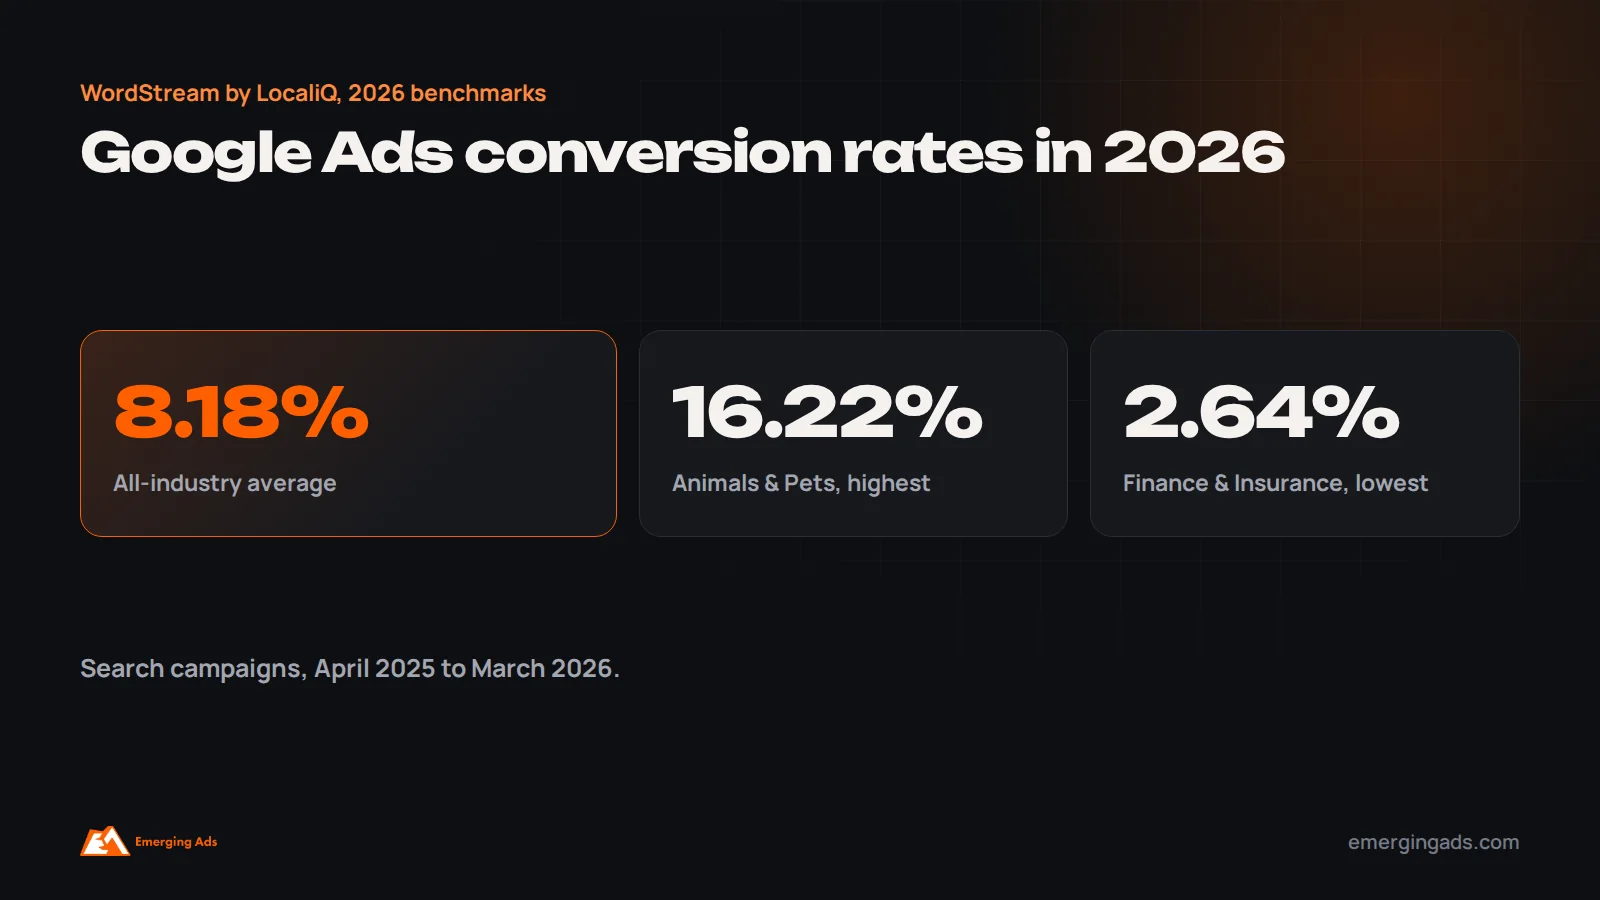
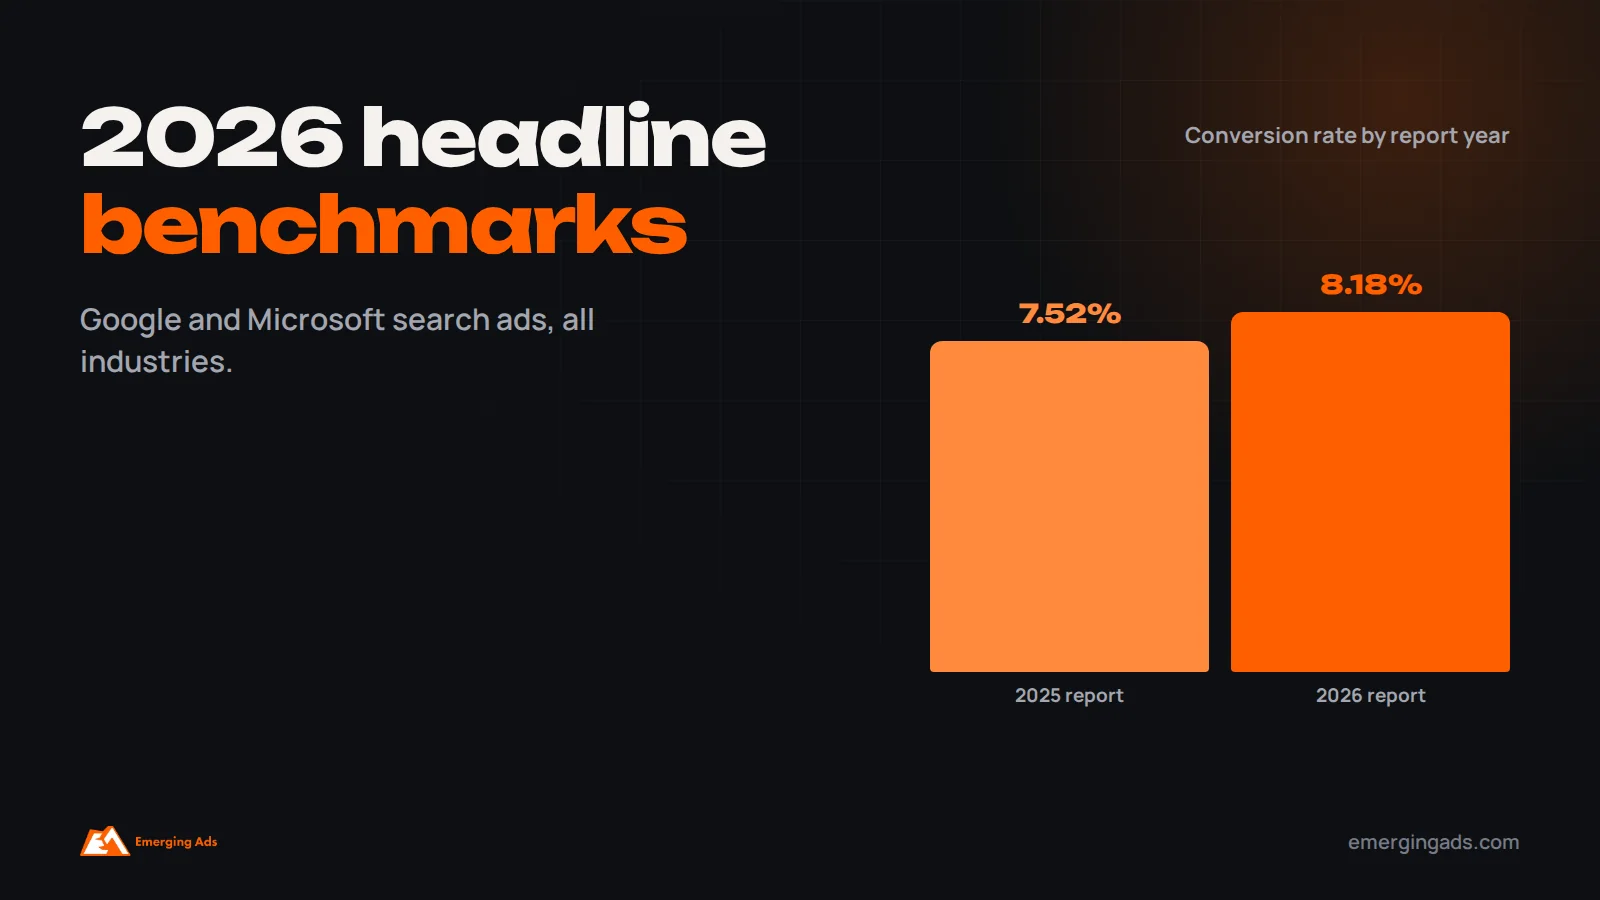
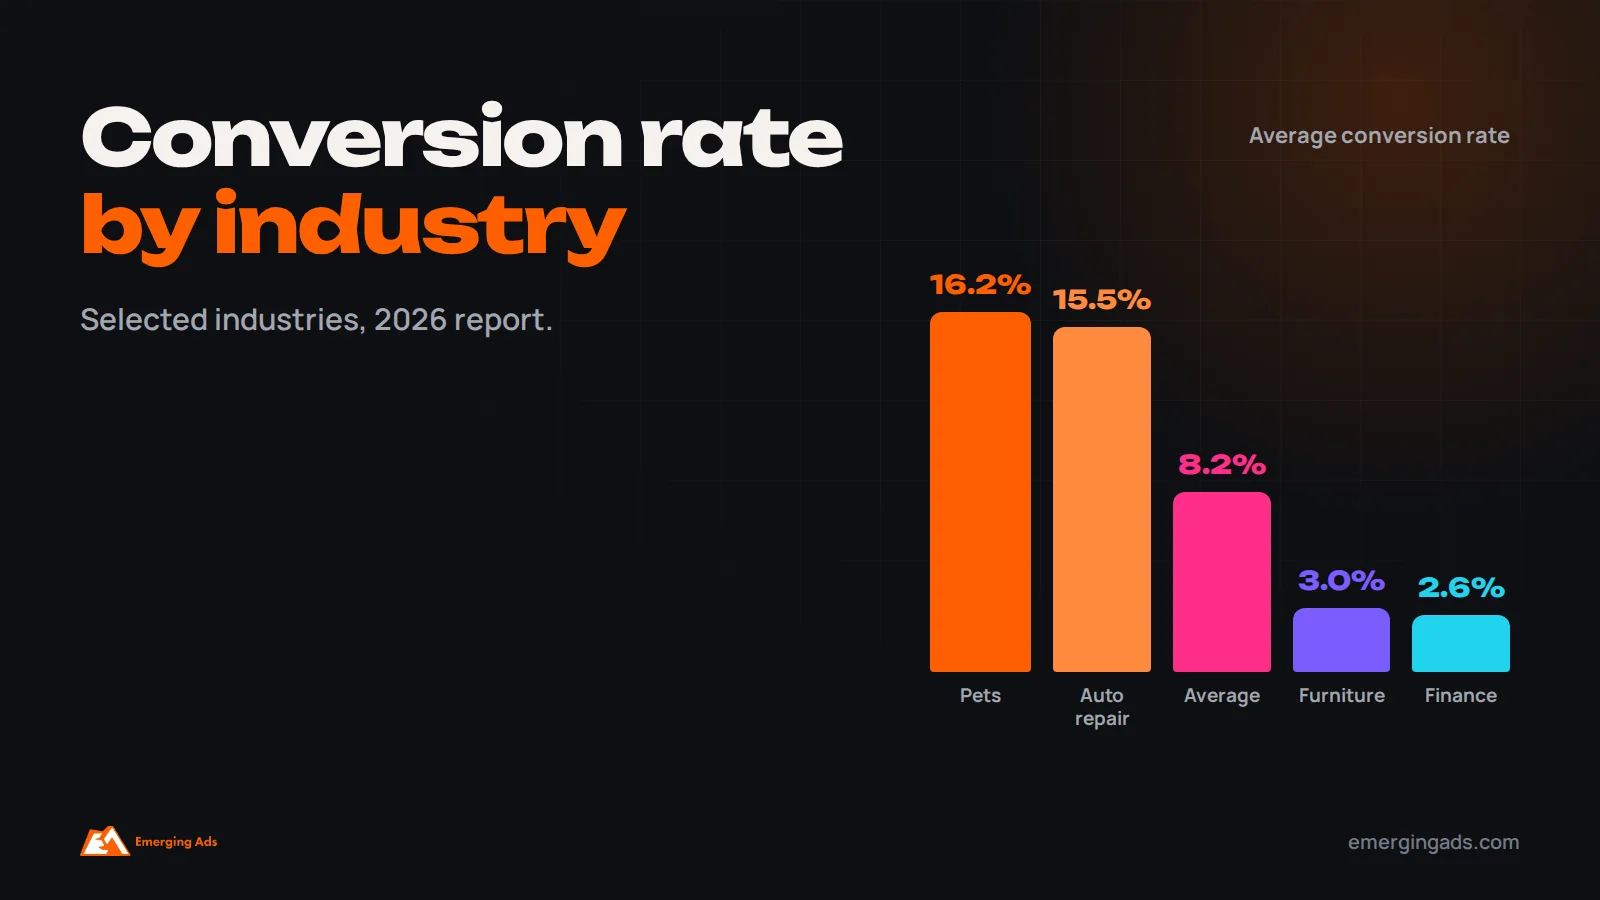
The average Google Ads search conversion rate across all industries is about 8.18%, according to WordStream by LocaliQ’s 2026 benchmark report, which analyzed Google and Microsoft Ads search campaigns from April 2025 to March 2026. Rates vary widely by industry: Animals and Pets (16.22%) and Automotive Repair, Service and Parts (15.51%) convert highest, while Finance and Insurance (2.64%), Furniture (2.99%) and Career and Employment (3.05%) convert lowest. Use these benchmarks as context, not targets, because your conversion definition, offer, landing page and sales cycle matter more than the industry average.
“Is our conversion rate good?” is one of the most common questions advertisers ask about Google Ads. Industry benchmarks help answer it, but only if you understand what they measure, where they come from and how your own campaigns differ from the average.
This guide summarizes the latest benchmark data, explains why conversion rates vary so much between industries, shows how to compare your own numbers fairly and sets out practical ways to improve conversion rate. We manage Google Ads for ecommerce and lead generation businesses through our Google Ads service. For related tactics, see our guides to lowering Google Ads CPA and lowering cost per click.
The 2026 headline numbers
WordStream by LocaliQ publishes one of the longest-running search advertising benchmark studies, now in its tenth edition. The 2026 report covers thousands of Google Ads and Microsoft Ads search campaigns across 20 industries, with data from April 2025 to March 2026, as summarized by Search Engine Journal. The all-industry averages were:
- Average conversion rate: 8.18%, up from 7.52% in the previous year’s report.
- Average click-through rate: 6.64%.
- Average cost per click: $5.42, up from $5.26 the year before.
In short, clicks keep getting more expensive, but the share of clicks that convert has also risen, partly because of better automation, conversion tracking and landing pages. The full industry tables are available in WordStream’s 2026 benchmark report.
Conversion rates by industry
The all-industry average hides very large differences between categories, so always check the figure for your own industry.
The 2026 report shows a very wide range between industries:
| Group | Industry | Average conversion rate (2026 report) |
|---|---|---|
| Highest | Animals & Pets | 16.22% |
| Highest | Automotive (Repair, Service & Parts) | 15.51% |
| All industries | Average | 8.18% |
| Lowest | Career & Employment | 3.05% |
| Lowest | Furniture | 2.99% |
| Lowest | Finance & Insurance | 2.64% |
For context, the previous year’s report (April 2024 to March 2025) listed conversion rates such as Physicians and Surgeons at 11.62%, Education and Instruction at 11.38%, Beauty and Personal Care at 7.82%, Business Services at 5.14%, Arts and Entertainment at 4.84%, Apparel, Fashion and Jewelry at 3.99% and Real Estate at 3.28%. Check the current report for your exact industry before setting expectations.
Biggest changes year over year
Benchmarks also move from year to year, sometimes sharply, so always use recent data when you set expectations for a new campaign.
According to the 2026 report, the industries with the largest conversion rate increases were Beauty and Personal Care (up about 32%), Personal Services (up about 27%) and Animals and Pets (up about 24%). The largest declines were in Career and Employment (down about 29%), Automotive for Sale (down about 23%) and Business Services (down about 6%). Economic conditions explain some of these shifts: weaker consumer spending on vehicles and a tougher job market both reduce conversion.
Why conversion rates vary so much
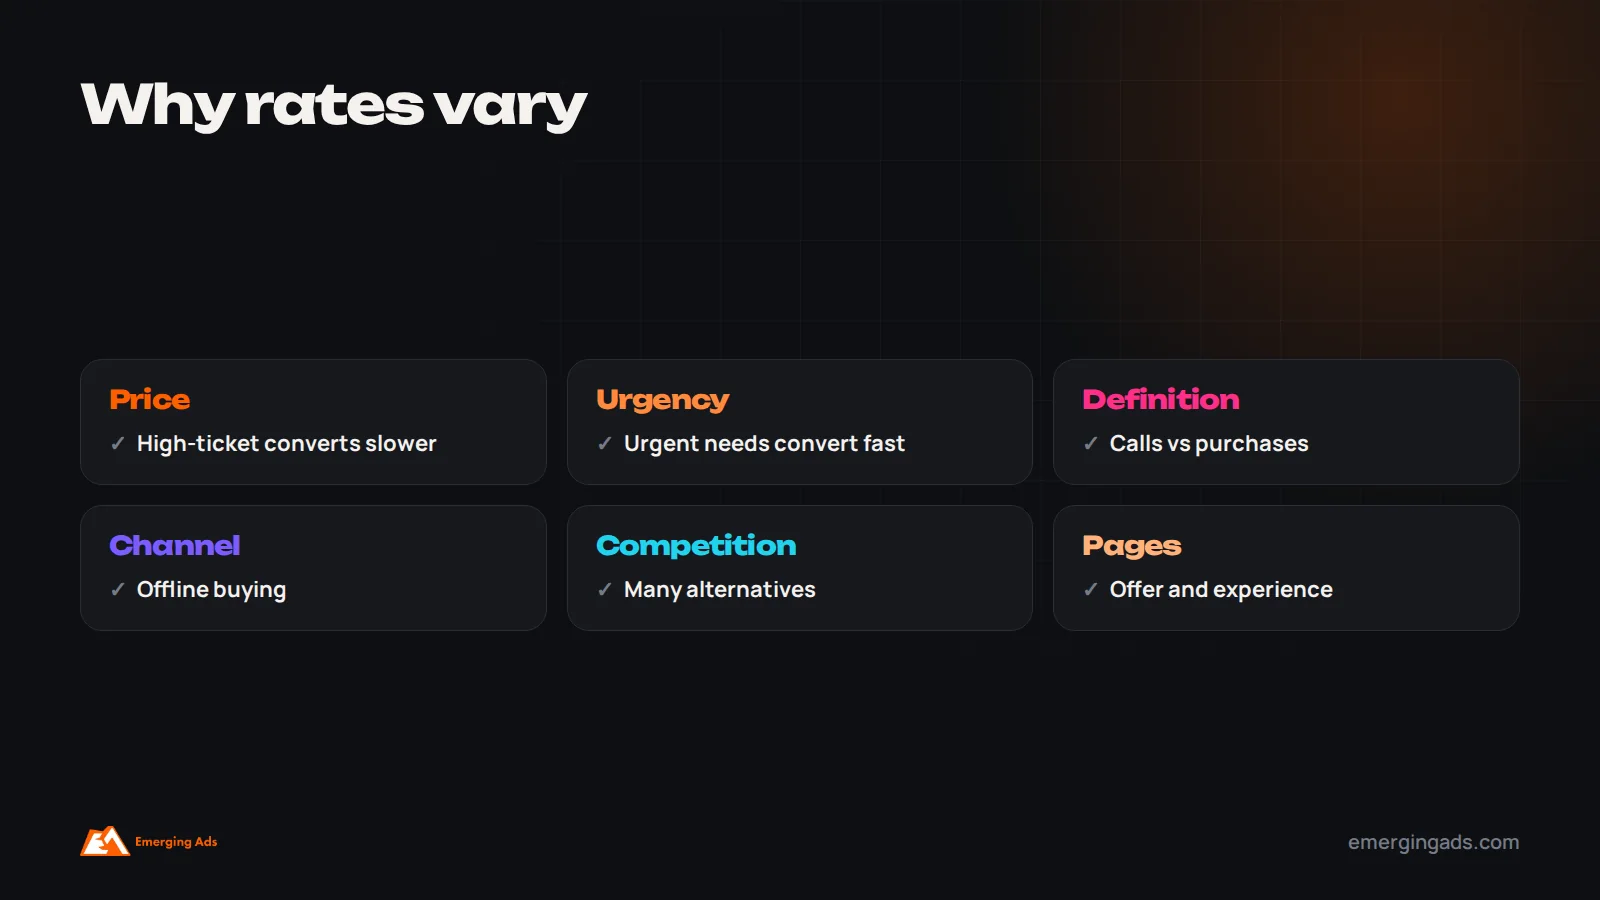
The gap between the highest and lowest industries is large, and it mostly reflects how people buy in each category rather than how well advertisers run their campaigns.
- Purchase size and risk: high-ticket, considered purchases such as furniture, finance and insurance convert less often per click because buyers research longer.
- Urgency: urgent local needs, such as a vet or car repair, convert quickly.
- Conversion definition: a phone call or form fill converts more often than a completed purchase.
- Online versus offline buying: industries where people research online but buy offline show lower tracked conversion rates.
- Competition: crowded searches give people many alternatives.
- Landing page and offer quality.
How to compare your own conversion rate
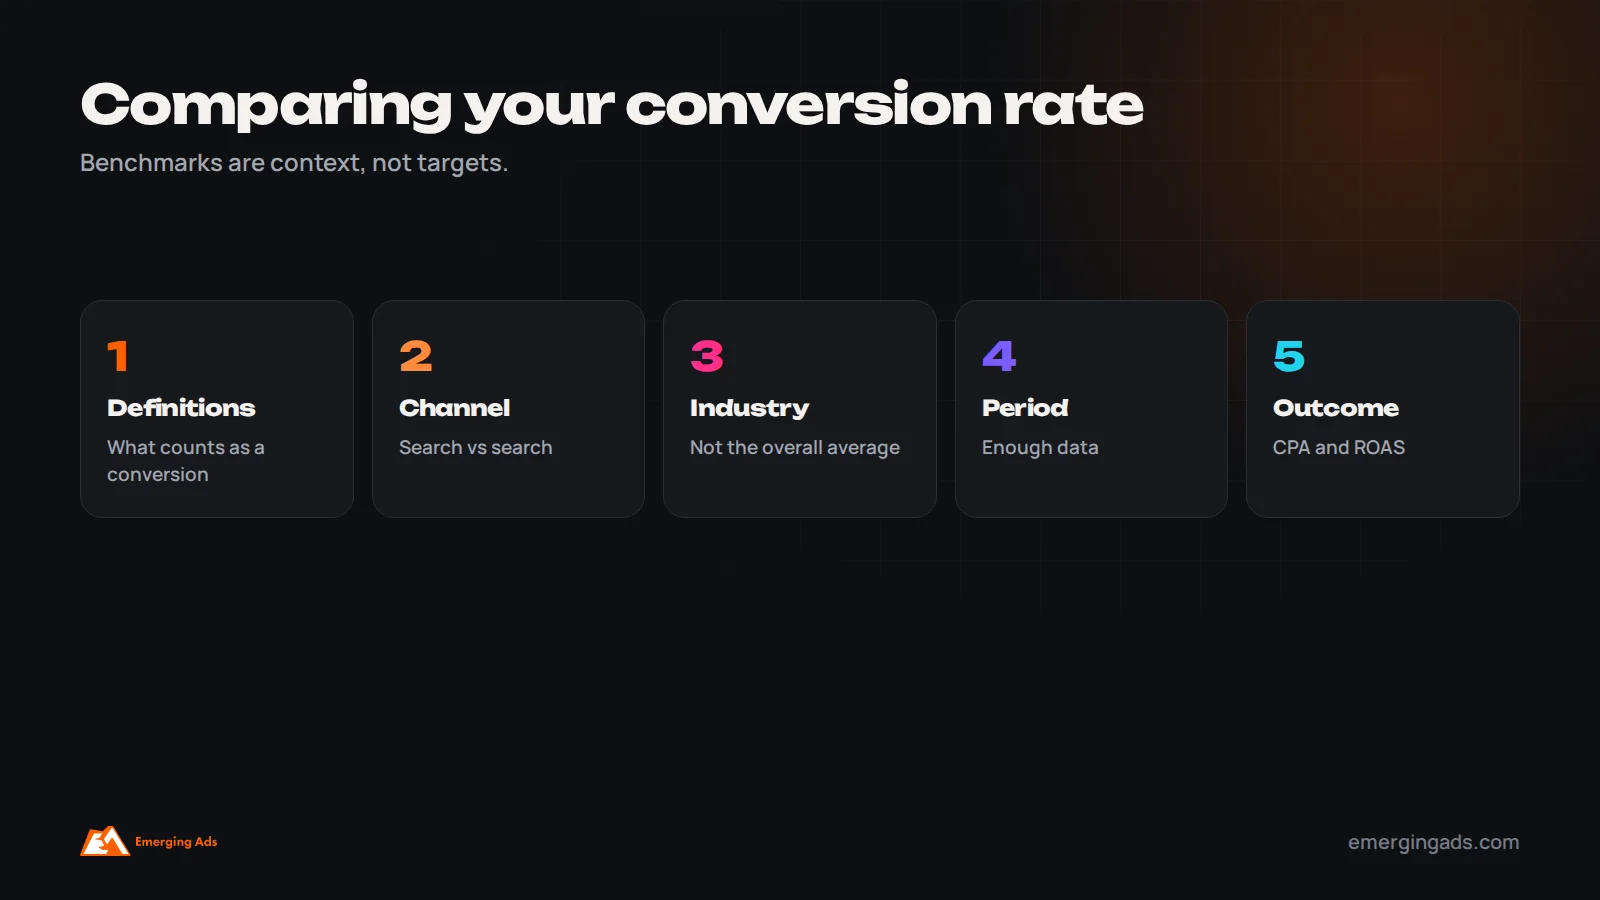
Comparing your numbers with a benchmark is only useful if you compare like with like. These checks make the comparison fair and meaningful.
Before comparing, check what your account counts as a conversion. Accounts that count page views, micro-actions or duplicate conversions inflate their rates; accounts that only count completed purchases look lower than lead generation benchmarks. Compare search campaigns with search benchmarks, not Performance Max or Display. Look at your industry, not the all-industry average. And compare over a meaningful period, since small accounts fluctuate. Most importantly, judge results on cost per acquisition and return, not conversion rate alone.
What “conversion rate” actually measures
Google Ads conversion rate is the number of conversions divided by the number of ad interactions, usually clicks. What counts as a conversion is defined by each advertiser, which is why comparisons can mislead. For a law firm, a conversion might be a phone call longer than a minute; for an ecommerce store, a completed purchase; for a SaaS company, a trial signup; for a local service business, a quote request. Some advertisers count every conversion, so one person submitting a form twice counts twice; others count only one per click. Some include secondary actions, such as newsletter signups or page views, as primary conversions. Benchmarks blend all of these approaches, so treat them as broad context rather than precise targets. The most useful comparison is your own account over time, using consistent conversion definitions.
What the numbers mean for specific industries
Legal services face the highest costs: the 2026 report found Attorneys and Legal Services had the highest average cost per click at $9.87 and the highest cost per lead at $131.63. That is often acceptable because a single client can be very valuable, but it makes landing pages, call handling and intake critical. Our guide to legal lead generation covers this.
Finance and insurance have the lowest conversion rates, reflecting complex products, comparison shopping and strict application processes. Measuring qualified applications and funded accounts, not just form fills, gives a truer picture. See our guide to finance industry marketing.
Furniture and other high-ticket retail convert less online because buyers research extensively and often purchase in store. Tracking store visits, calls and assisted conversions matters.
Real estate saw the largest cost-per-click increase in the 2026 report, at about 27%, so efficient targeting and strong lead follow-up are increasingly important. Our real estate marketing guide covers the wider strategy.
Animals and pets, automotive repair and other urgent local services convert highly because searchers need help quickly. Fast call answering and clear availability make the most of that intent.
Health, medical and fitness businesses vary widely; physicians and surgeons converted well in the previous year’s report, while health and fitness saw cost per click rise sharply in 2026.
Ecommerce stores should compare purchase conversion rates with ecommerce-specific benchmarks rather than lead generation averages, and focus on return on ad spend.
Look beyond conversion rate
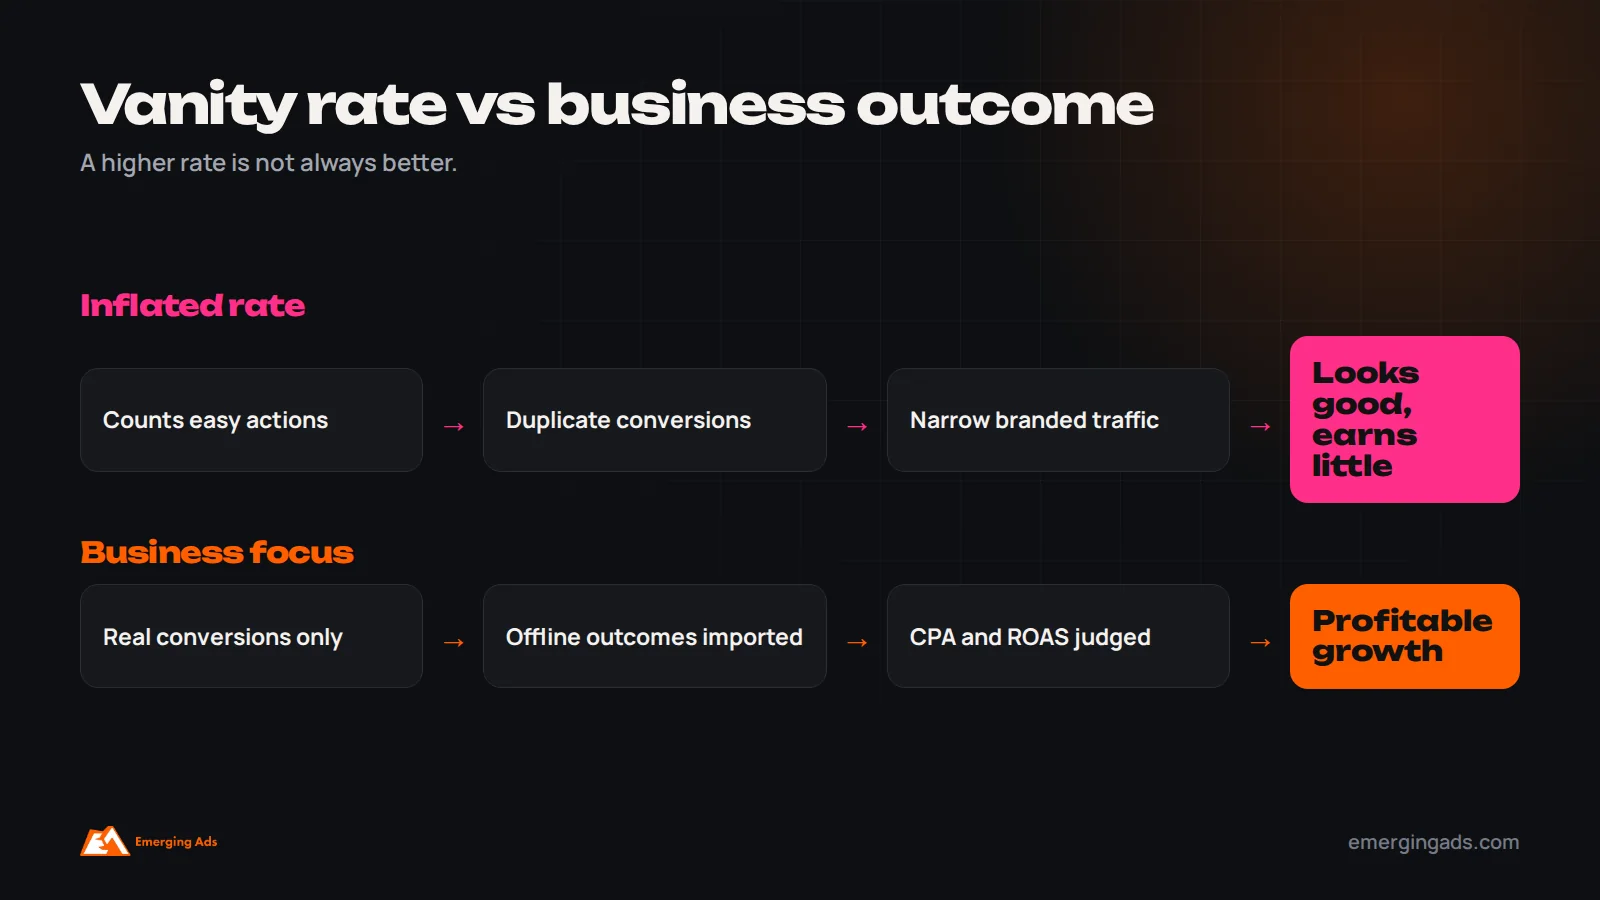
A higher conversion rate is not always better. Campaigns can raise conversion rates by targeting only branded searches, counting easy actions or narrowing reach so much that total conversions fall. The metrics that matter most are cost per acquisition, return on ad spend, lead quality and total profitable conversions. A campaign with a lower conversion rate but much higher order values or better lead quality can be far more valuable. Use conversion rate as a diagnostic signal alongside these business outcomes.
Make sure tracking is accurate
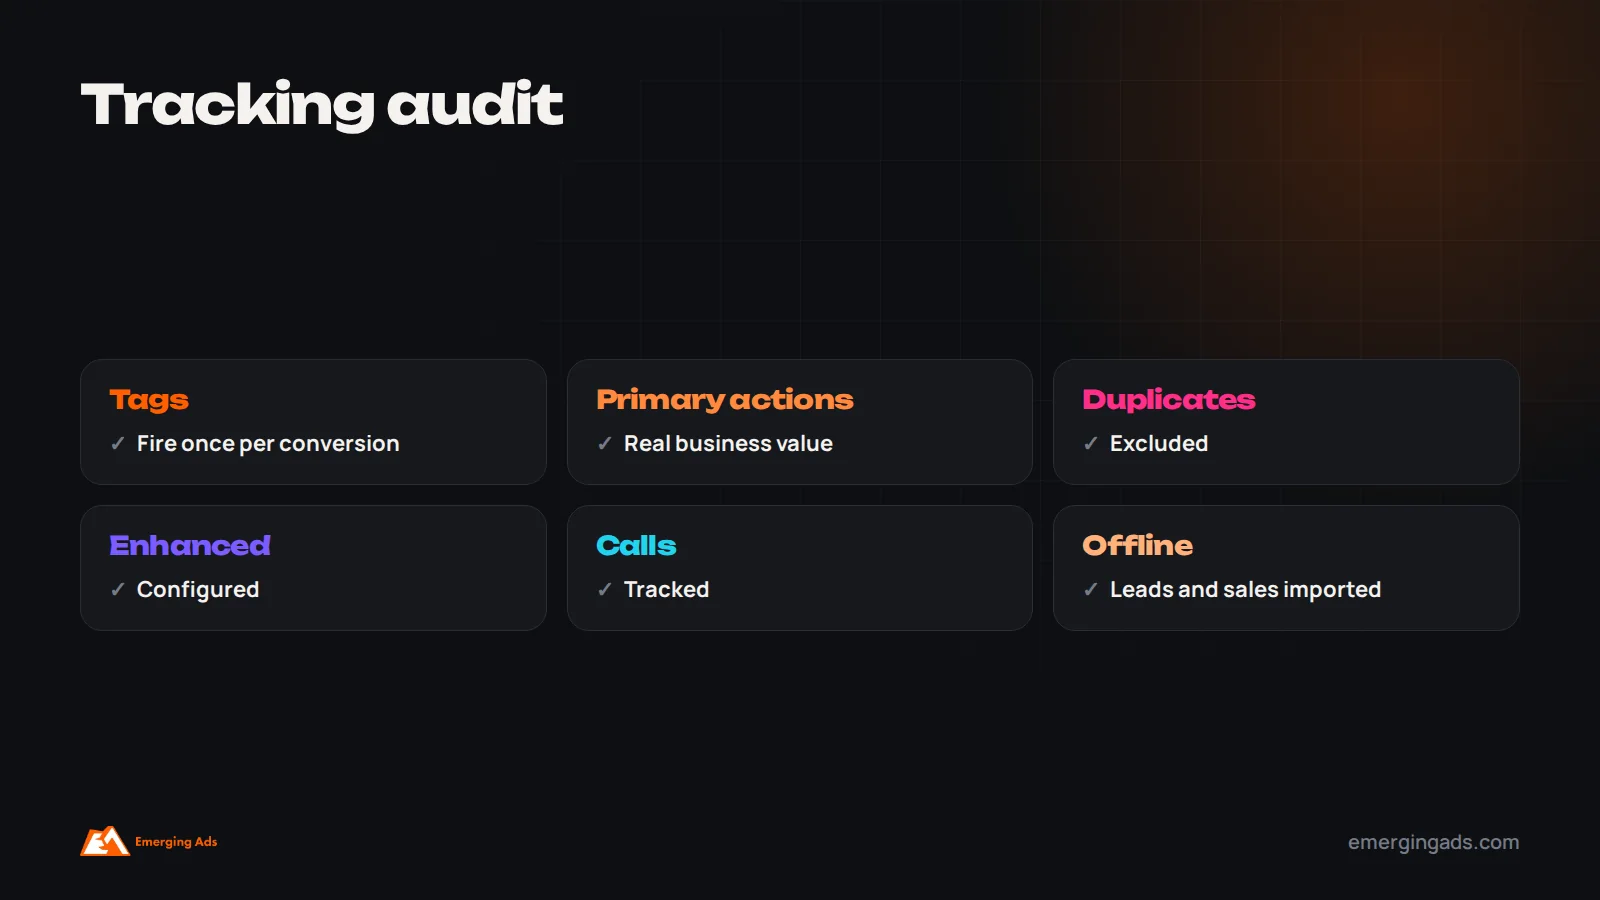
Benchmarks are only useful if your own data is reliable. Audit conversion tracking regularly: check that tags fire once per genuine conversion, that primary conversion actions reflect real business value, that duplicate or test conversions are excluded, that enhanced conversions are configured where appropriate, and that phone calls are tracked. For lead generation, import offline conversion data such as qualified leads and closed sales, so Google’s bidding learns which clicks become customers. Our guide on attribution modeling explains how to measure across channels.
How conversion rate connects to cost per lead
Conversion rate and cost per click together determine cost per conversion. If your average cost per click is $5 and your conversion rate is 10%, each conversion costs about $50; if the conversion rate drops to 5%, the same clicks produce conversions at about $100 each. This is why improving conversion rate is often the fastest way to lower acquisition costs: it multiplies the value of every click you already pay for. The 2026 benchmarks show this tension clearly. Average costs per click rose again, but higher conversion rates offset much of the increase. Industries such as Travel, Beauty and Personal Care and Physicians and Surgeons saw notable decreases in cost per lead in the 2026 report, while the lowest costs per lead were in Arts and Entertainment, Automotive Repair and Restaurants and Food, at roughly $27 to $31.
Search compared with other campaign types
The benchmarks discussed here cover search campaigns. Other Google Ads campaign types behave differently. Display campaigns usually have much lower conversion rates because they reach people who were not searching. Shopping campaigns are measured mainly on purchases and return on ad spend. Performance Max blends many inventory types, so its conversion rate depends on the mix of search, shopping, display, YouTube and other placements it uses. YouTube campaigns often drive conversions indirectly, through later searches and visits. Compare each campaign type with appropriate expectations rather than holding all of them to search benchmarks.
Benchmarks outside the United States
The WordStream by LocaliQ data is based mainly on US campaigns. Conversion rates and costs differ in other markets. In the UK, costs per click are often somewhat lower than in the US for many industries, while competitive sectors such as legal and finance remain expensive. In the UAE and Saudi Arabia, costs per click can be lower in many categories, but conversion depends heavily on Arabic and English landing pages, WhatsApp contact options and fast follow-up. In India, costs per click are generally much lower, but conversion rates and order values vary widely by sector and city. Use US benchmarks as broad context and build your own baselines for each market you advertise in.
B2B and long sales cycles
B2B advertisers, such as software companies, consultancies and industrial suppliers, often see lower conversion rates for meaningful actions such as demo requests, because buyers research carefully and involve several people. They may also have higher conversion rates on lighter actions, such as content downloads. The key is to track the full funnel: from click to lead, qualified lead, opportunity and closed deal, importing outcomes into Google Ads so bidding optimizes for leads that become revenue. Our guide on B2B lead generation covers the wider approach.
Mobile, calls and conversion rate
Most searches now happen on phones, and mobile users often prefer to call or message rather than fill in forms. Businesses that track only form submissions may underestimate their true conversion rate. Use call assets, call tracking from websites, and messaging options where appropriate, and make sure mobile landing pages load quickly with click-to-call buttons visible. For local services, calls often make up the majority of valuable conversions.
Examples from our clients
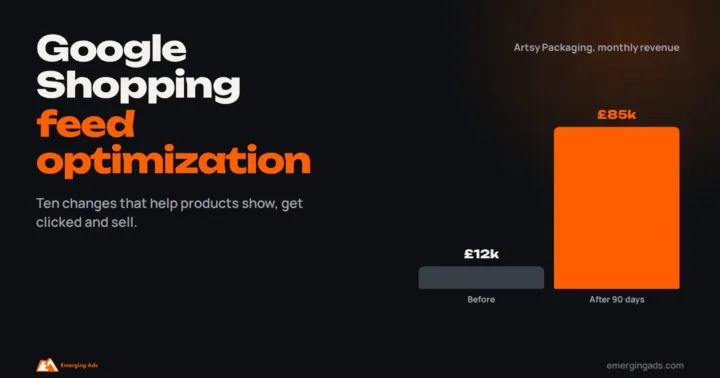
Benchmarks become more useful alongside real results. For Artsy Packaging, a UK packaging business, restructuring Google Ads around high-intent searches, tighter targeting and better landing pages cut cost per acquisition by 71% and delivered a 9.2x return on ad spend within 90 days, while growing monthly revenue from Google Ads from about £12,000 to £85,000 on the same budget. For Recov Athlete, a US high-ticket fitness brand, Google Ads achieved a 6.07x return on ad spend. For NetNutri, a US supplements brand, Google Ads produced more than 10,000 purchases at an average cost per click of $0.46. In each case, improvements came from the same levers described in this guide: intent-focused keywords, relevant landing pages, accurate conversion tracking and disciplined bidding. Our Artsy Packaging case study covers the details.
Diagnosing a low conversion rate
If your conversion rate is well below your industry benchmark, work through a simple diagnosis. First, check tracking: are conversions firing correctly, and are calls and offline outcomes counted? Second, review search terms: are you paying for irrelevant or research-only searches? Third, check landing pages: do they match the ads, load quickly on mobile and make the next step obvious? Fourth, examine the offer and pricing: are competitors offering something more attractive? Fifth, look at segments: are particular devices, locations, times or campaigns dragging the average down? Fixing the biggest problem in this sequence usually produces the largest improvement.
Checking a suspiciously high conversion rate
A conversion rate far above your industry benchmark is worth checking too. Common causes include counting page views or button clicks as conversions, duplicate counting, including branded campaigns that capture people already looking for you, or counting low-value micro-actions as primary conversions. These inflate reported performance and can mislead automated bidding into optimizing for actions that do not produce revenue. Make sure primary conversion actions reflect real business value.
Using benchmarks in planning
Benchmarks are useful for setting early expectations when you launch a new account or enter a new industry, for sense-checking forecasts and for explaining performance to stakeholders. Use them to estimate a reasonable range for cost per conversion: multiply expected cost per click by the inverse of the expected conversion rate. Then replace benchmark assumptions with your own data as soon as campaigns have run long enough to produce reliable numbers. Your own historical performance, adjusted for seasonality, is always a better guide than an industry average.
Automation, AI and conversion rates
Part of the rise in average conversion rates reflects how Google Ads now works. Smart bidding, broad match combined with strong signals, AI-generated ad variations and automated campaign types can find converting searches more efficiently than manual management, provided they receive accurate conversion data. The same automation can also optimize toward the wrong goal if tracking counts low-value actions. Advertisers who supply clean conversion data, value-based signals such as revenue or lead quality, and good creative assets tend to benefit most. Those who leave tracking and goals poorly configured often see conversion rates rise on paper while real business results stay flat.
A quick conversion rate checklist
Check that conversion actions reflect real business value and fire once per conversion; that calls and offline outcomes are tracked; that you compare search campaigns with search benchmarks for your own industry; that keywords focus on buying intent with up-to-date negatives; that each ad group has a matching landing page; that pages load fast on mobile with a clear call to action and trust signals; that the offer is competitive; that bidding uses accurate data; and that you judge success by cost per acquisition and return, not conversion rate alone.
Seasonality and conversion rates
Conversion rates change through the year. Retailers often see higher conversion rates around major shopping events, when buyers arrive ready to purchase, though competition and costs also rise. Education converts strongly around enrollment periods, travel around booking seasons, fitness in January and tax services before filing deadlines. In the Gulf, Ramadan changes shopping and browsing patterns significantly. When comparing your performance with benchmarks or with previous months, account for these seasonal patterns, and compare the same period year over year where possible. A drop in conversion rate after a peak season is often normal rather than a sign of a problem.
Landing page factors that matter most
Across industries, a handful of landing page factors consistently affect Google Ads conversion rates. Speed matters: slow pages lose visitors before they see the offer, especially on mobile. Relevance matters: the headline should echo the search and the ad. Clarity matters: visitors should understand what is offered, for whom and what happens next within seconds. Trust matters: reviews, ratings, accreditations, guarantees and recognizable client logos reduce hesitation. Friction matters: every extra form field, distracting link or unclear step reduces conversions. Testing improvements to these factors, one at a time, is one of the most reliable ways to beat your industry benchmark. Our landing page design team builds and tests pages for paid traffic.
Advice for small advertisers
Small accounts with modest budgets can still achieve strong conversion rates by focusing. Choose the services or products with the best margins and clearest search demand, target a tight geographic area, use specific keywords with strong intent, send traffic to dedicated landing pages, answer calls and enquiries quickly, and track conversions accurately from the start. A small, focused account often converts better than a large, sprawling one.
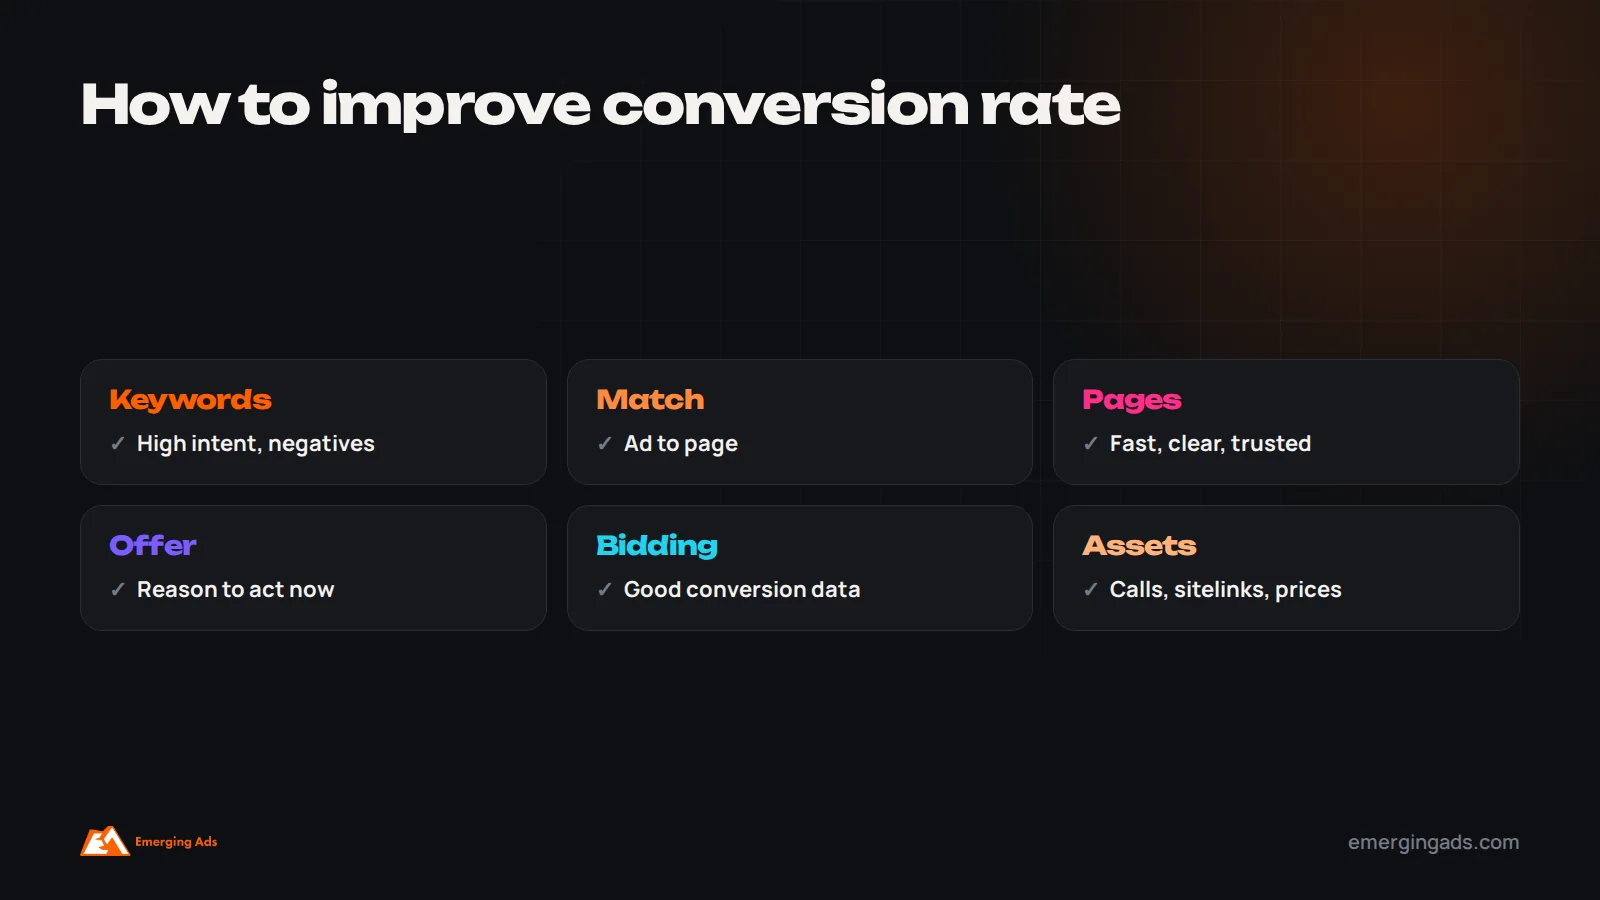
How to improve your Google Ads conversion rate
Tighten keyword targeting
Broad keywords attract searchers with the wrong intent. Focus budget on keywords that show clear buying or hiring intent, such as product names, “near me”, “price”, “book” or “quote”, and review the search terms report regularly to add negative keywords for irrelevant searches. Separating high-intent and research keywords into different campaigns lets you bid appropriately for each.
Match ads and landing pages
Every ad group should send people to a page that matches the search and the ad’s promise. A search for “emergency boiler repair” should land on a page about fast boiler repair, not a general services page. Matching headline, offer and imagery reduces bounce and lifts conversion, and can improve quality scores and lower costs.
Improve landing page experience
Fast mobile loading, a clear headline, prominent call to action, short forms, trust signals such as reviews and accreditations near the button, and clear pricing or next steps all raise conversion. Test one major change at a time. Our guide to conversion rate optimization explains the process.
Strengthen the offer
Sometimes the page is fine but the offer is weak. Free consultations, quotes, trials, guarantees, fast delivery, bundles or limited-time incentives can make the difference, especially in competitive industries.
Use the right bidding strategy
Smart bidding strategies such as target CPA or target ROAS can lift conversion rates when they have accurate conversion data and enough volume. Feed them good signals by tracking the right actions and, for lead generation, importing offline outcomes such as qualified leads or sales.
Use assets and extensions
Call, sitelink, callout, structured snippet, price and location assets give searchers more reasons and ways to act, and can lift both click-through and conversion rates.
Schedule and target wisely
Review performance by hour, day, device and location. Reduce bids when conversion rates are low, such as outside business hours for call-based businesses, and increase them when they are high.
About the data
The figures in this guide come from WordStream by LocaliQ’s annual Search Advertising Benchmarks, as reported by Search Engine Journal for the 2026 edition and by the 2025 edition for prior-year comparisons. The data covers Google Ads and Microsoft Ads search campaigns, mainly in the United States, across around 20 industry categories. Conversion definitions vary by advertiser, and averages can hide wide variation within each industry. Other benchmark sources may report different figures because they use different samples, time periods and definitions, so treat any single number as an indicator rather than a precise standard. We will update this guide when new benchmark data is published.
Getting help with Google Ads
If your conversion rate is well below your industry average, or your cost per acquisition is rising faster than you can afford, an experienced Google Ads specialist can audit tracking, keywords, landing pages and bidding to find the biggest opportunities. Ask any agency how they would measure success, how they handle conversion tracking and offline data, and what results they have achieved in your industry.
Frequently asked questions
What is the average Google Ads conversion rate in 2026?
About 8.18% across all industries for Google and Microsoft search ads, according to WordStream by LocaliQ’s 2026 benchmarks covering April 2025 to March 2026.
Which industries have the highest Google Ads conversion rates?
In the 2026 report, Animals and Pets (16.22%) and Automotive Repair, Service and Parts (15.51%) were highest.
Which industries have the lowest conversion rates?
Finance and Insurance (2.64%), Furniture (2.99%) and Career and Employment (3.05%) were lowest in the 2026 report.
What is a good Google Ads conversion rate?
One that is at or above your industry’s benchmark and, more importantly, produces a profitable cost per acquisition for your business.
Why is my conversion rate lower than average?
Common reasons include broad keywords, weak landing pages, slow mobile pages, a weak offer, strict conversion definitions or an industry with long buying cycles.
Why is my conversion rate higher than average?
It may reflect strong performance, or it may mean you count easy actions or duplicate conversions. Check your conversion settings.
Is conversion rate the most important metric?
No. Cost per acquisition, return on ad spend and lead quality matter more.
How often are benchmarks updated?
WordStream by LocaliQ publishes updated benchmarks annually.