
Average Marketing Budget as a Percentage of Revenue by Industry

Key Takeaways
- Marketing budget as a share of revenue varies by a factor of three or more across industries, blended averages hide more than they reveal.
- E-commerce and SaaS businesses typically run higher marketing-to-revenue ratios than manufacturing or professional services.
- Growth-stage companies spend a meaningfully higher share of revenue on marketing than mature, established ones.
- A reasonable budget split runs roughly 35-45% paid media, 15-20% content/SEO, 10-15% tools, 10-15% creative, adjusted by business model.
- Benchmarking against your own category beats anchoring to a generic industry-wide number.
Why a Single Average Number Misleads
Marketing spend as a percentage of revenue swings dramatically by business model, an e-commerce brand competing on paid acquisition looks nothing like a professional services firm growing mostly through referral and reputation. A single blended average across all industries is close to useless for budgeting your own business.
Budget Ranges by Industry
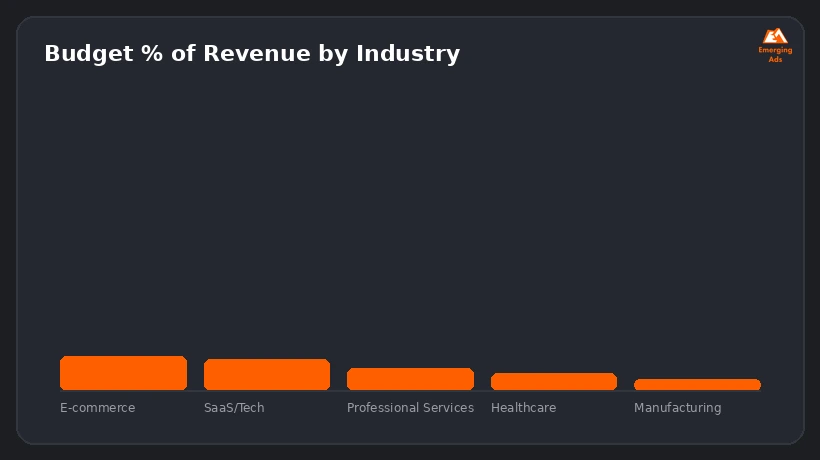
- E-commerce and DTC brands typically run among the highest marketing-to-revenue ratios, paid acquisition is often the primary growth engine
- SaaS and tech businesses run high ratios too, weighted toward demand generation and content
- Professional services firms typically run lower ratios, growth leans more on referral and reputation
- Healthcare and regulated industries often run lower ratios due to compliance constraints on advertising
- Manufacturing and B2B industrial businesses typically run the lowest ratios of the common categories
How Budget Shifts by Growth Stage
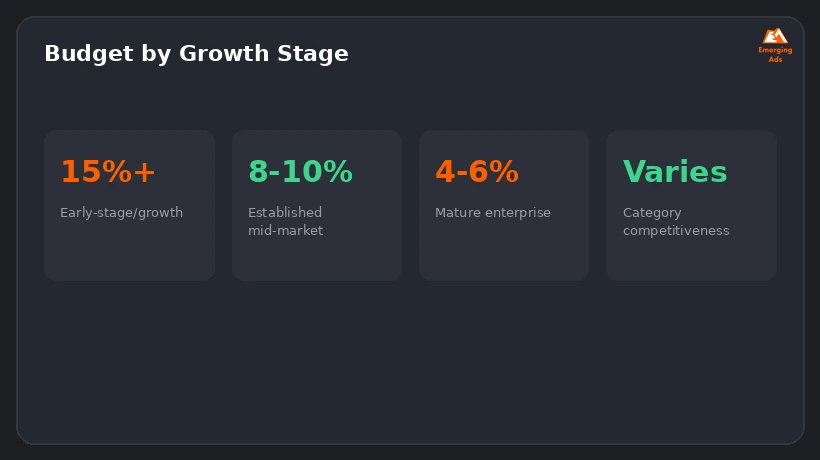
Early-stage and growth-mode companies often invest well above what a mature business in the same category would, prioritizing acquisition and market share over near-term margin. Established mid-market businesses typically settle into a steadier, lower ratio once growth stabilizes, and mature enterprises often run the leanest ratios of all, leaning on brand equity built over years.
A Reasonable Channel Allocation Split
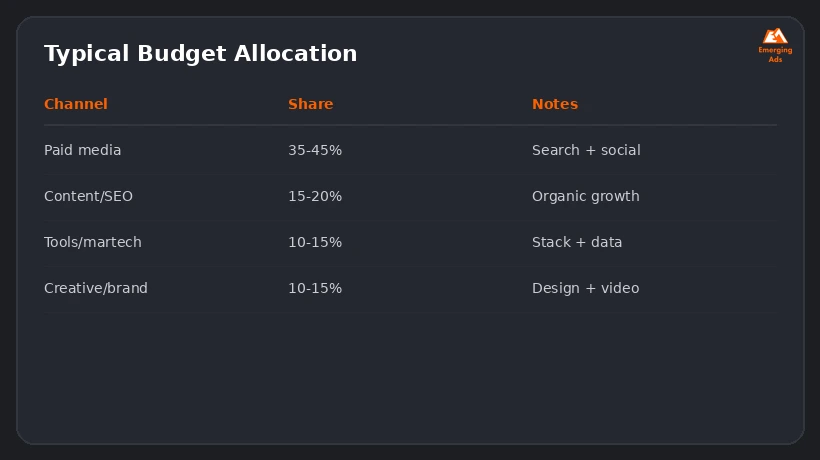
Within whatever total percentage you land on, a reasonable starting split runs roughly 35-45% paid media, 15-20% content and SEO, 10-15% tools and martech, and 10-15% creative and brand work, adjusted based on how much of your growth currently depends on paid acquisition versus organic and brand channels.
Building Your Own Benchmark
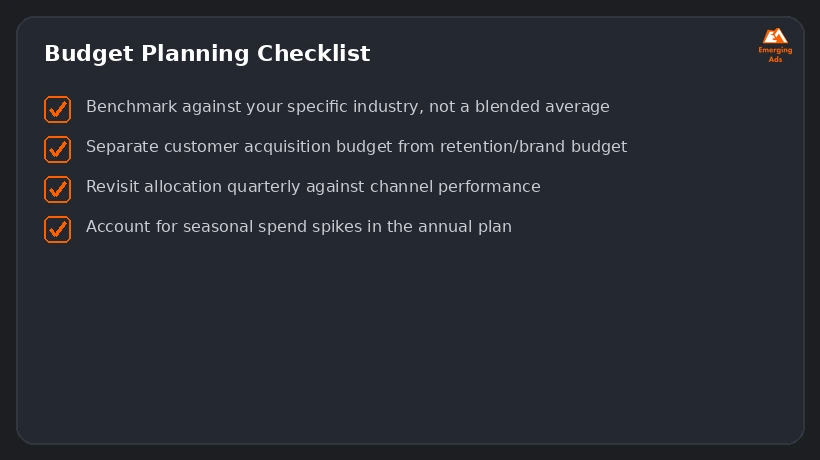
Rather than anchoring to an industry-wide figure, benchmark against businesses genuinely comparable to yours in category, growth stage, and go-to-market model, and revisit the allocation quarterly against actual channel performance rather than treating the initial split as fixed for the year.
Want us to look at your account?
We’ll audit your setup and tell you exactly where the budget is leaking, free.
Get Your Free Ad AuditFrequently Asked Questions
What percentage of revenue should a small business spend on marketing?
It varies by industry and growth stage, but many growth-focused small businesses land in the high single digits to mid-teens percentage range, established businesses often run lower.
Do e-commerce businesses spend more on marketing than service businesses?
Generally yes, e-commerce growth often depends more directly on paid acquisition, while service businesses frequently grow through referral and reputation, which shows up as a lower direct marketing spend ratio.
Should marketing budget be based on revenue or on customer acquisition goals?
Both matter, revenue-based budgeting sets a sustainable ceiling, while acquisition-goal-based budgeting ensures the number actually supports what you’re trying to achieve, the two should be reconciled, not chosen exclusively.
How much of a marketing budget should go to paid advertising versus organic channels?
A common starting range is 35-45% toward paid media, with the remainder split across content, tools, and creative, though the right split depends heavily on how much of your current growth already comes from organic channels.
Do growth-stage companies really spend more on marketing than mature ones?
Yes, typically, growth-stage companies often prioritize market share and acquisition over near-term margin, while mature companies can rely more on existing brand equity and customer base.
How often should a marketing budget be reviewed?
Quarterly is a reasonable cadence, it’s frequent enough to react to channel performance shifts without constantly disrupting campaigns that need time to mature.
Is there a standard marketing budget percentage that works across all industries?
No, the range across industries is wide enough that a single standard figure isn’t meaningful, benchmark against your own category and business model instead.
Should compliance costs be counted as part of the marketing budget in regulated industries?
It depends on how your business tracks costs internally, but compliance review overhead is a real cost of marketing in regulated industries and should be accounted for in planning even if budgeted separately.
How do I know if I’m underspending on marketing relative to competitors?
Compare your growth rate and market share trajectory against comparable competitors, a consistently slower growth rate despite similar market conditions can be a signal of underinvestment, though it’s not the only possible cause.
Does marketing budget as a percentage of revenue include salaries for an in-house team?
Conventions vary by business, some count fully-loaded team costs within the marketing budget percentage, others track media and tooling spend separately from headcount, be consistent with whichever convention you use for benchmarking.
Ready to fix what’s costing you conversions?
Book a free, no-pressure audit of your ad account or website.
Get Your Free Ad Audit